
Artist
Unidentified maker
American
Publisher
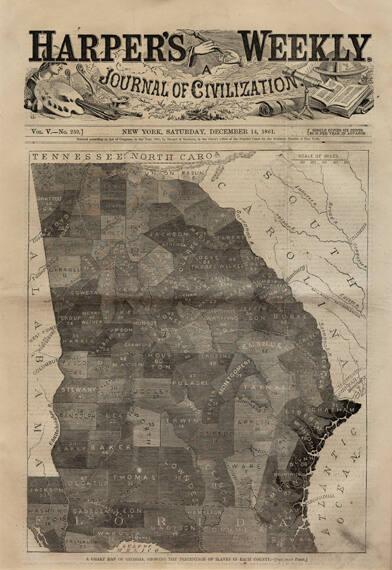
Harper's Weekly, published by Harper & Brothers
American, 1857 - 1916
A Chart Map of Georgia, Showing the Percentage of Slaves in Each County, from Harper's Weekly
Date1861
MediumWood engraving on paper
DimensionsImage: 10 3/4 × 9 1/8 in. (27.3 × 23.2 cm)
Sheet: 15 7/8 × 11 1/4 in. (40.3 × 28.6 cm)
Sheet: 15 7/8 × 11 1/4 in. (40.3 × 28.6 cm)
Credit LineGeorgia Museum of Art, University of Georgia; The Andrew Ladis and William Underwood Eiland Collection, Gift of William Underwood Eiland
Object number2022.317

Thorvald Marthinsen Sølvvarefabrikk
1880 - 1940